Define your questions
Identify the decisions you need to make and the data and measures you need to examine.
Data analysis & dashboards
Explore trends in your data and build dashboards around the questions your team needs to answer.
Describe your process to create a first version with AI.
1,000 free credits at signup, then 500 monthly. Upgrade to publish.





Your workflow
Explore comparisons and trends in your data, then build dashboards that make the results useful to each team.
Identify the decisions you need to make and the data and measures you need to examine.
Compare measures across categories and time periods, apply filters and investigate trends.
Arrange charts, summaries and supporting records in views suited to each audience.
Choose who can view reporting information and test permissions before rollout.
Example screens
Illustrative examples of what you can build and configure with Fliplet.
For teams
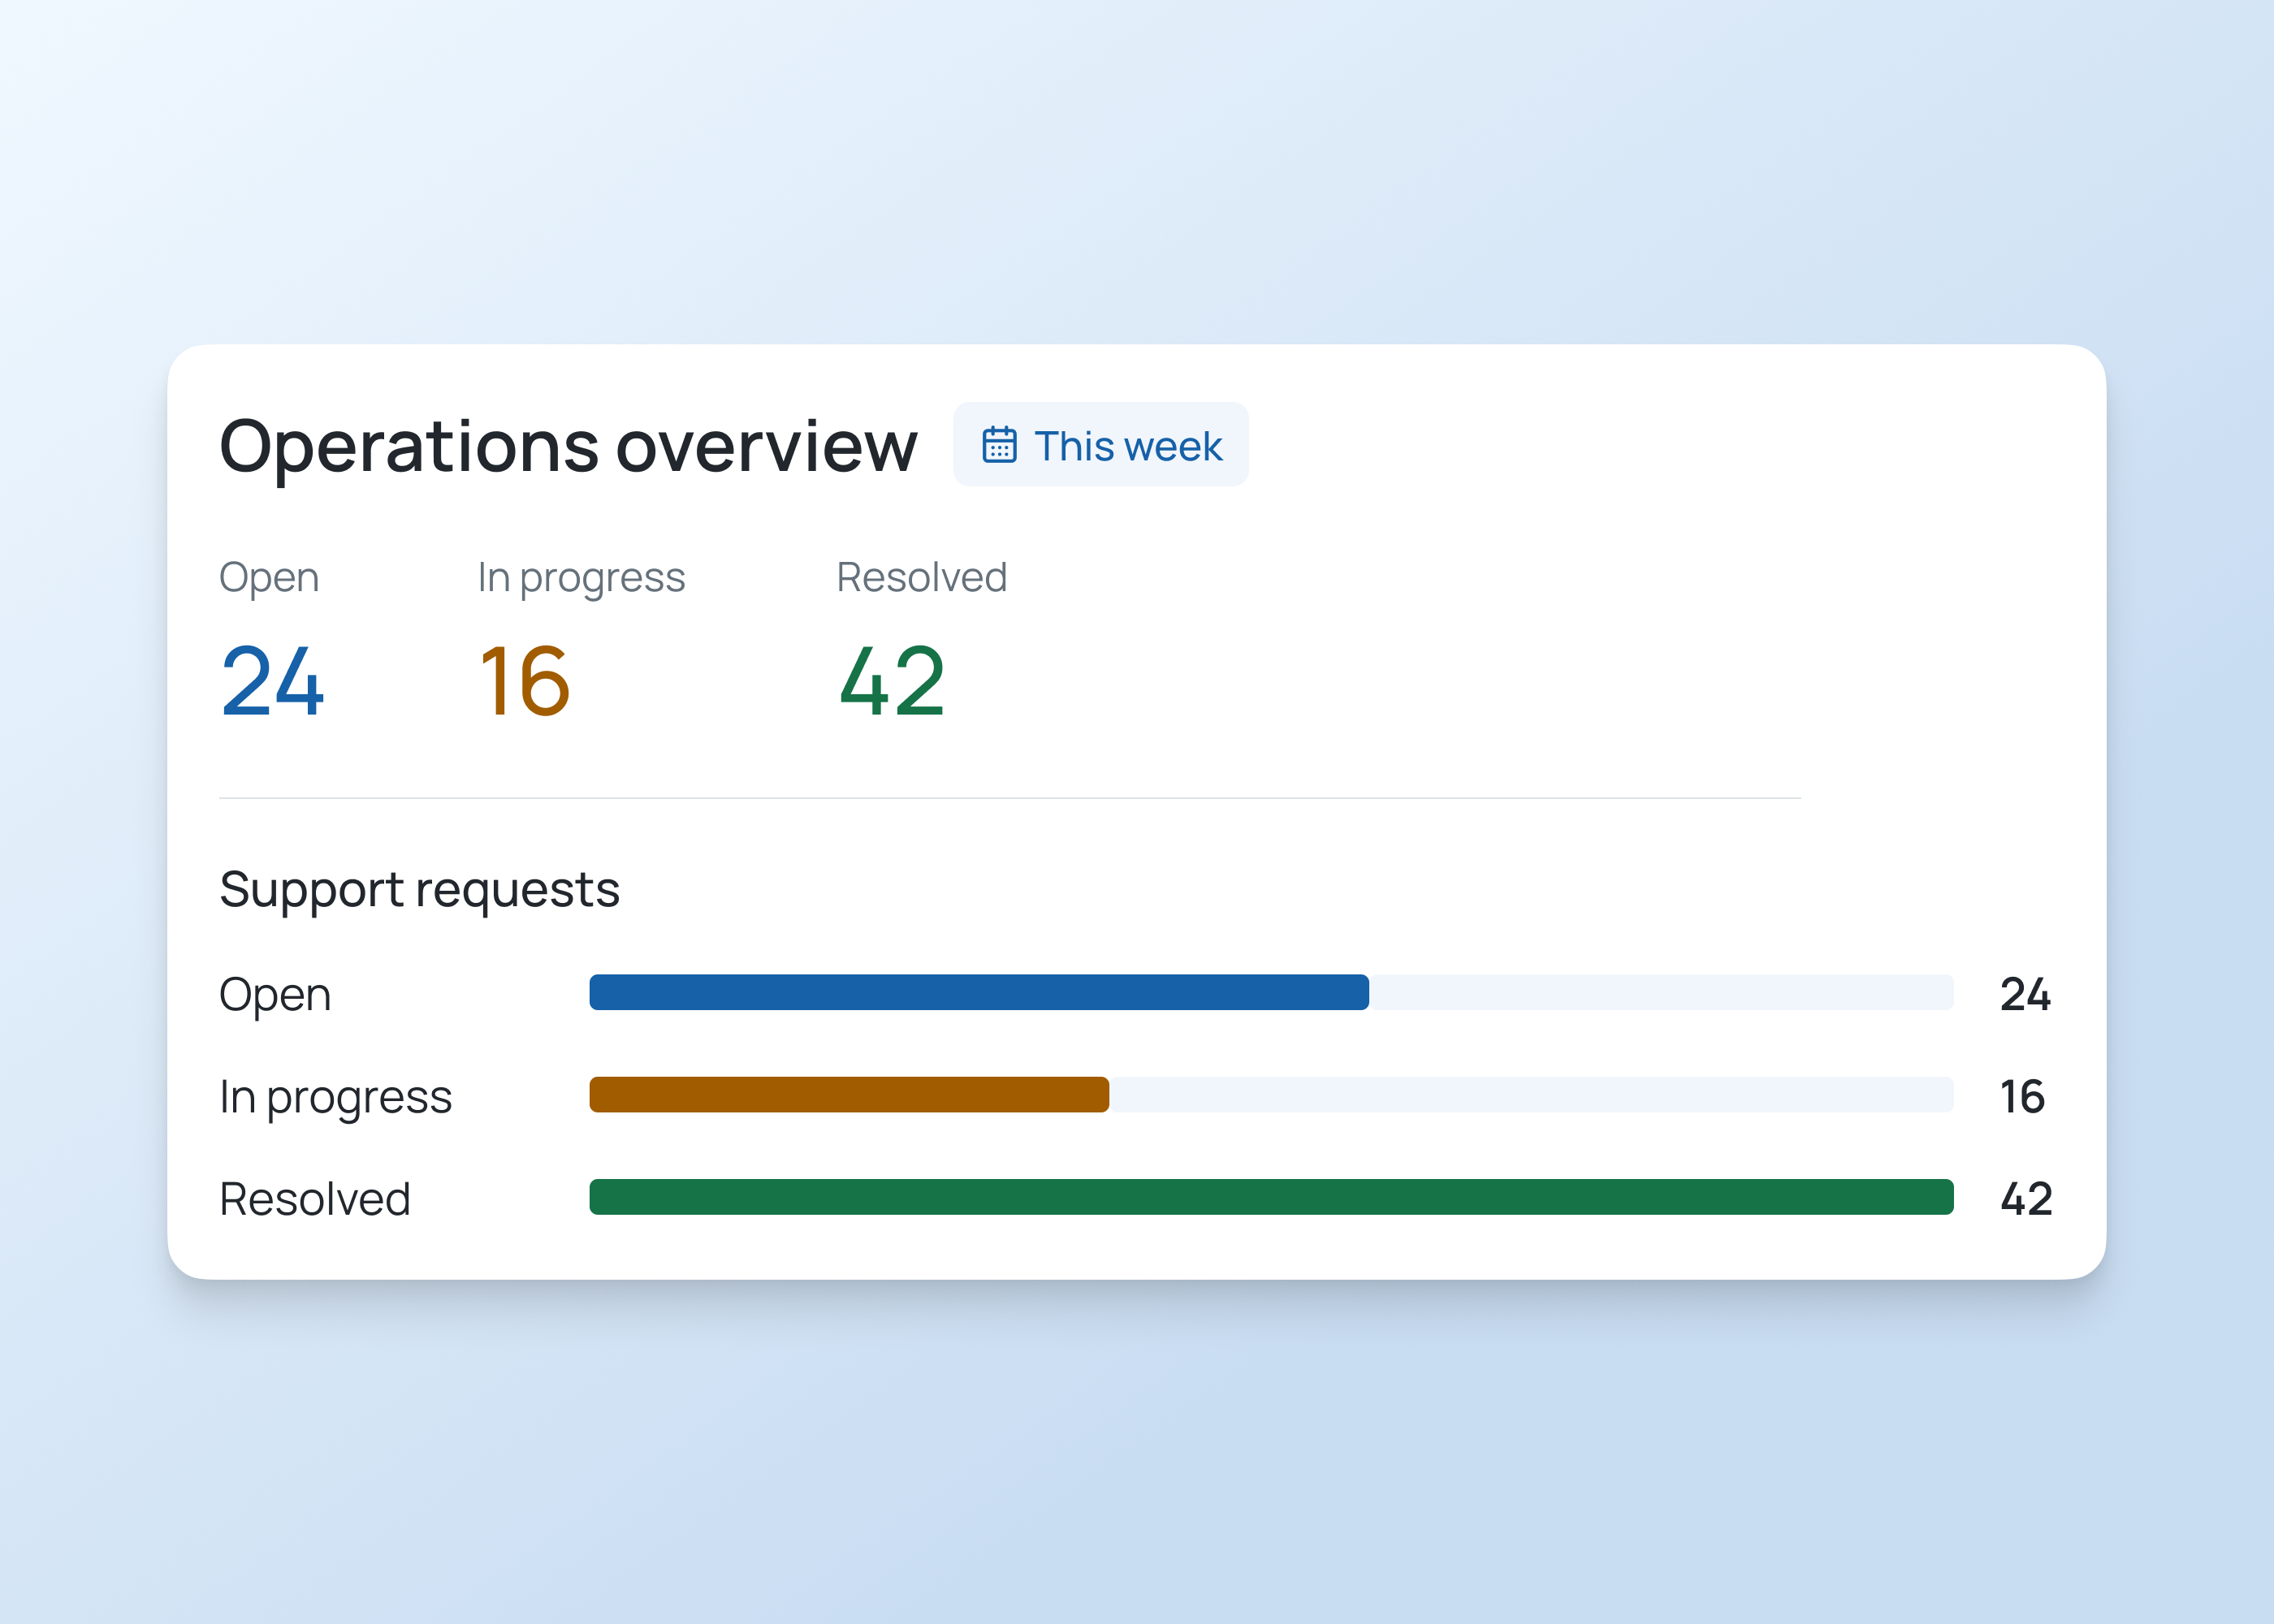
Compare agreed figures across periods and categories to see what changed and where to investigate.
For data owners
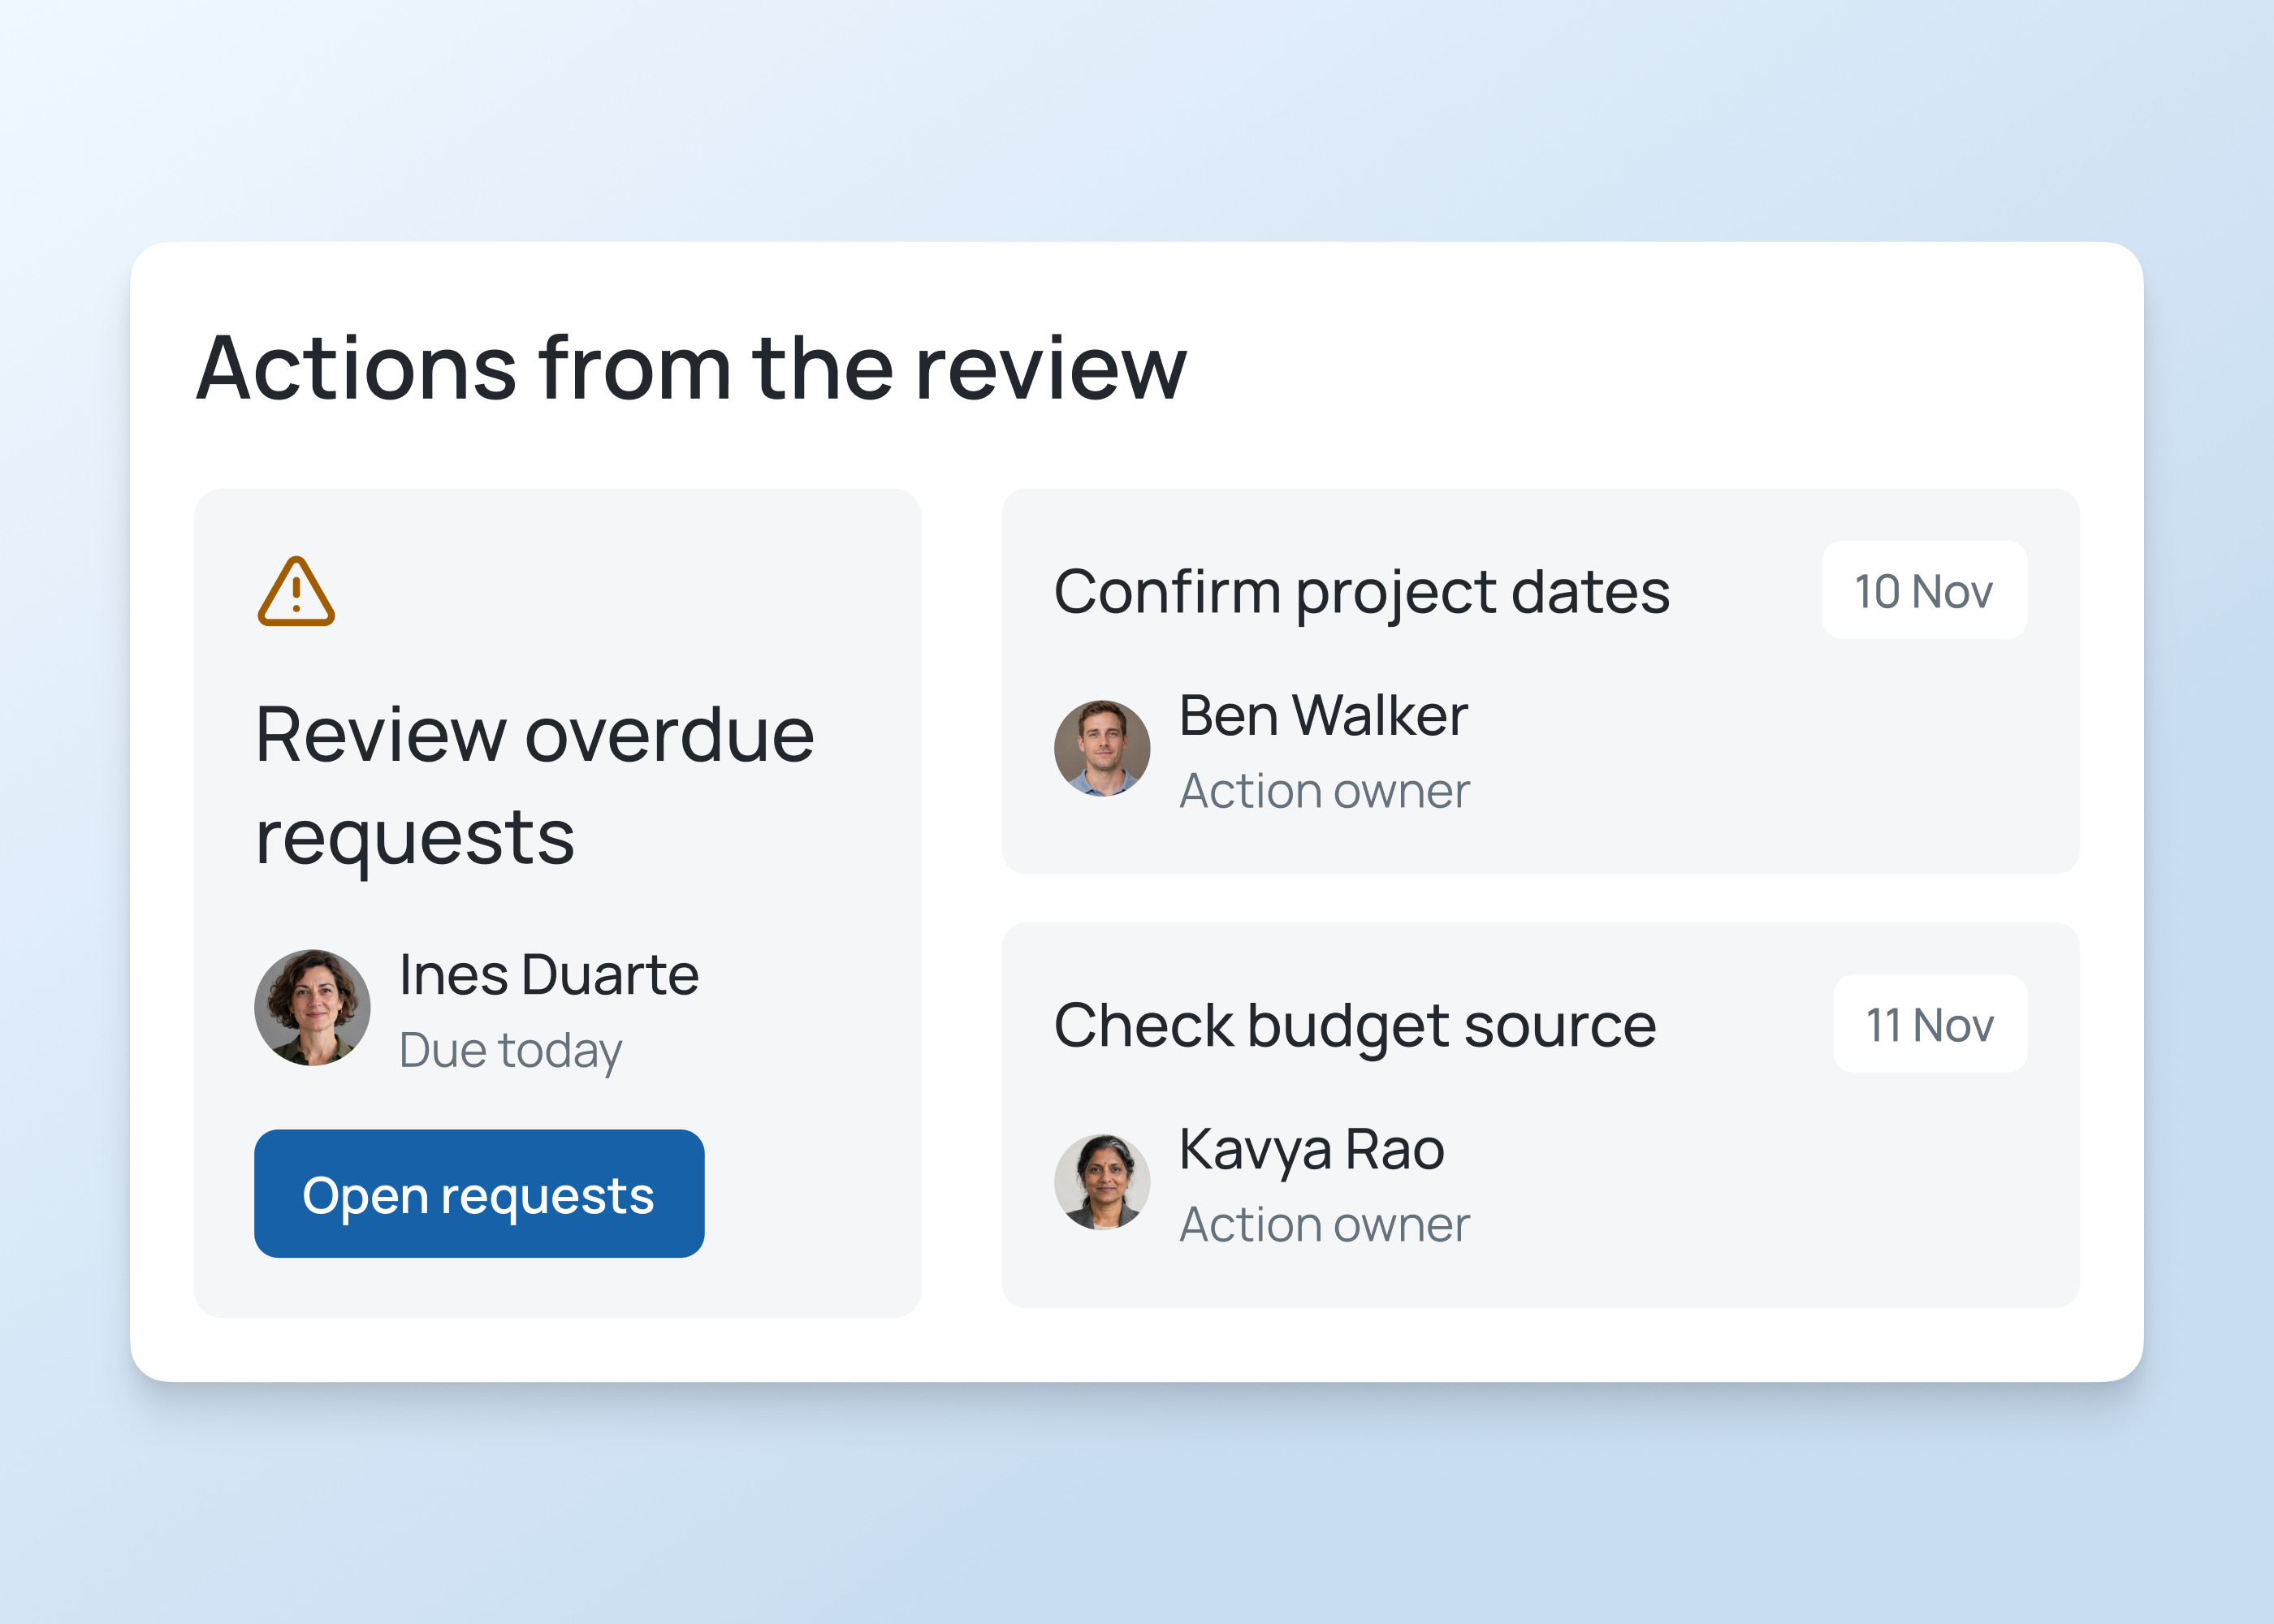
Show measures, related activities and owners together so the team can plan follow-up.
Data analysis and dashboards
Start with the questions your team needs to answer, compare the right data, then choose what belongs in each dashboard.
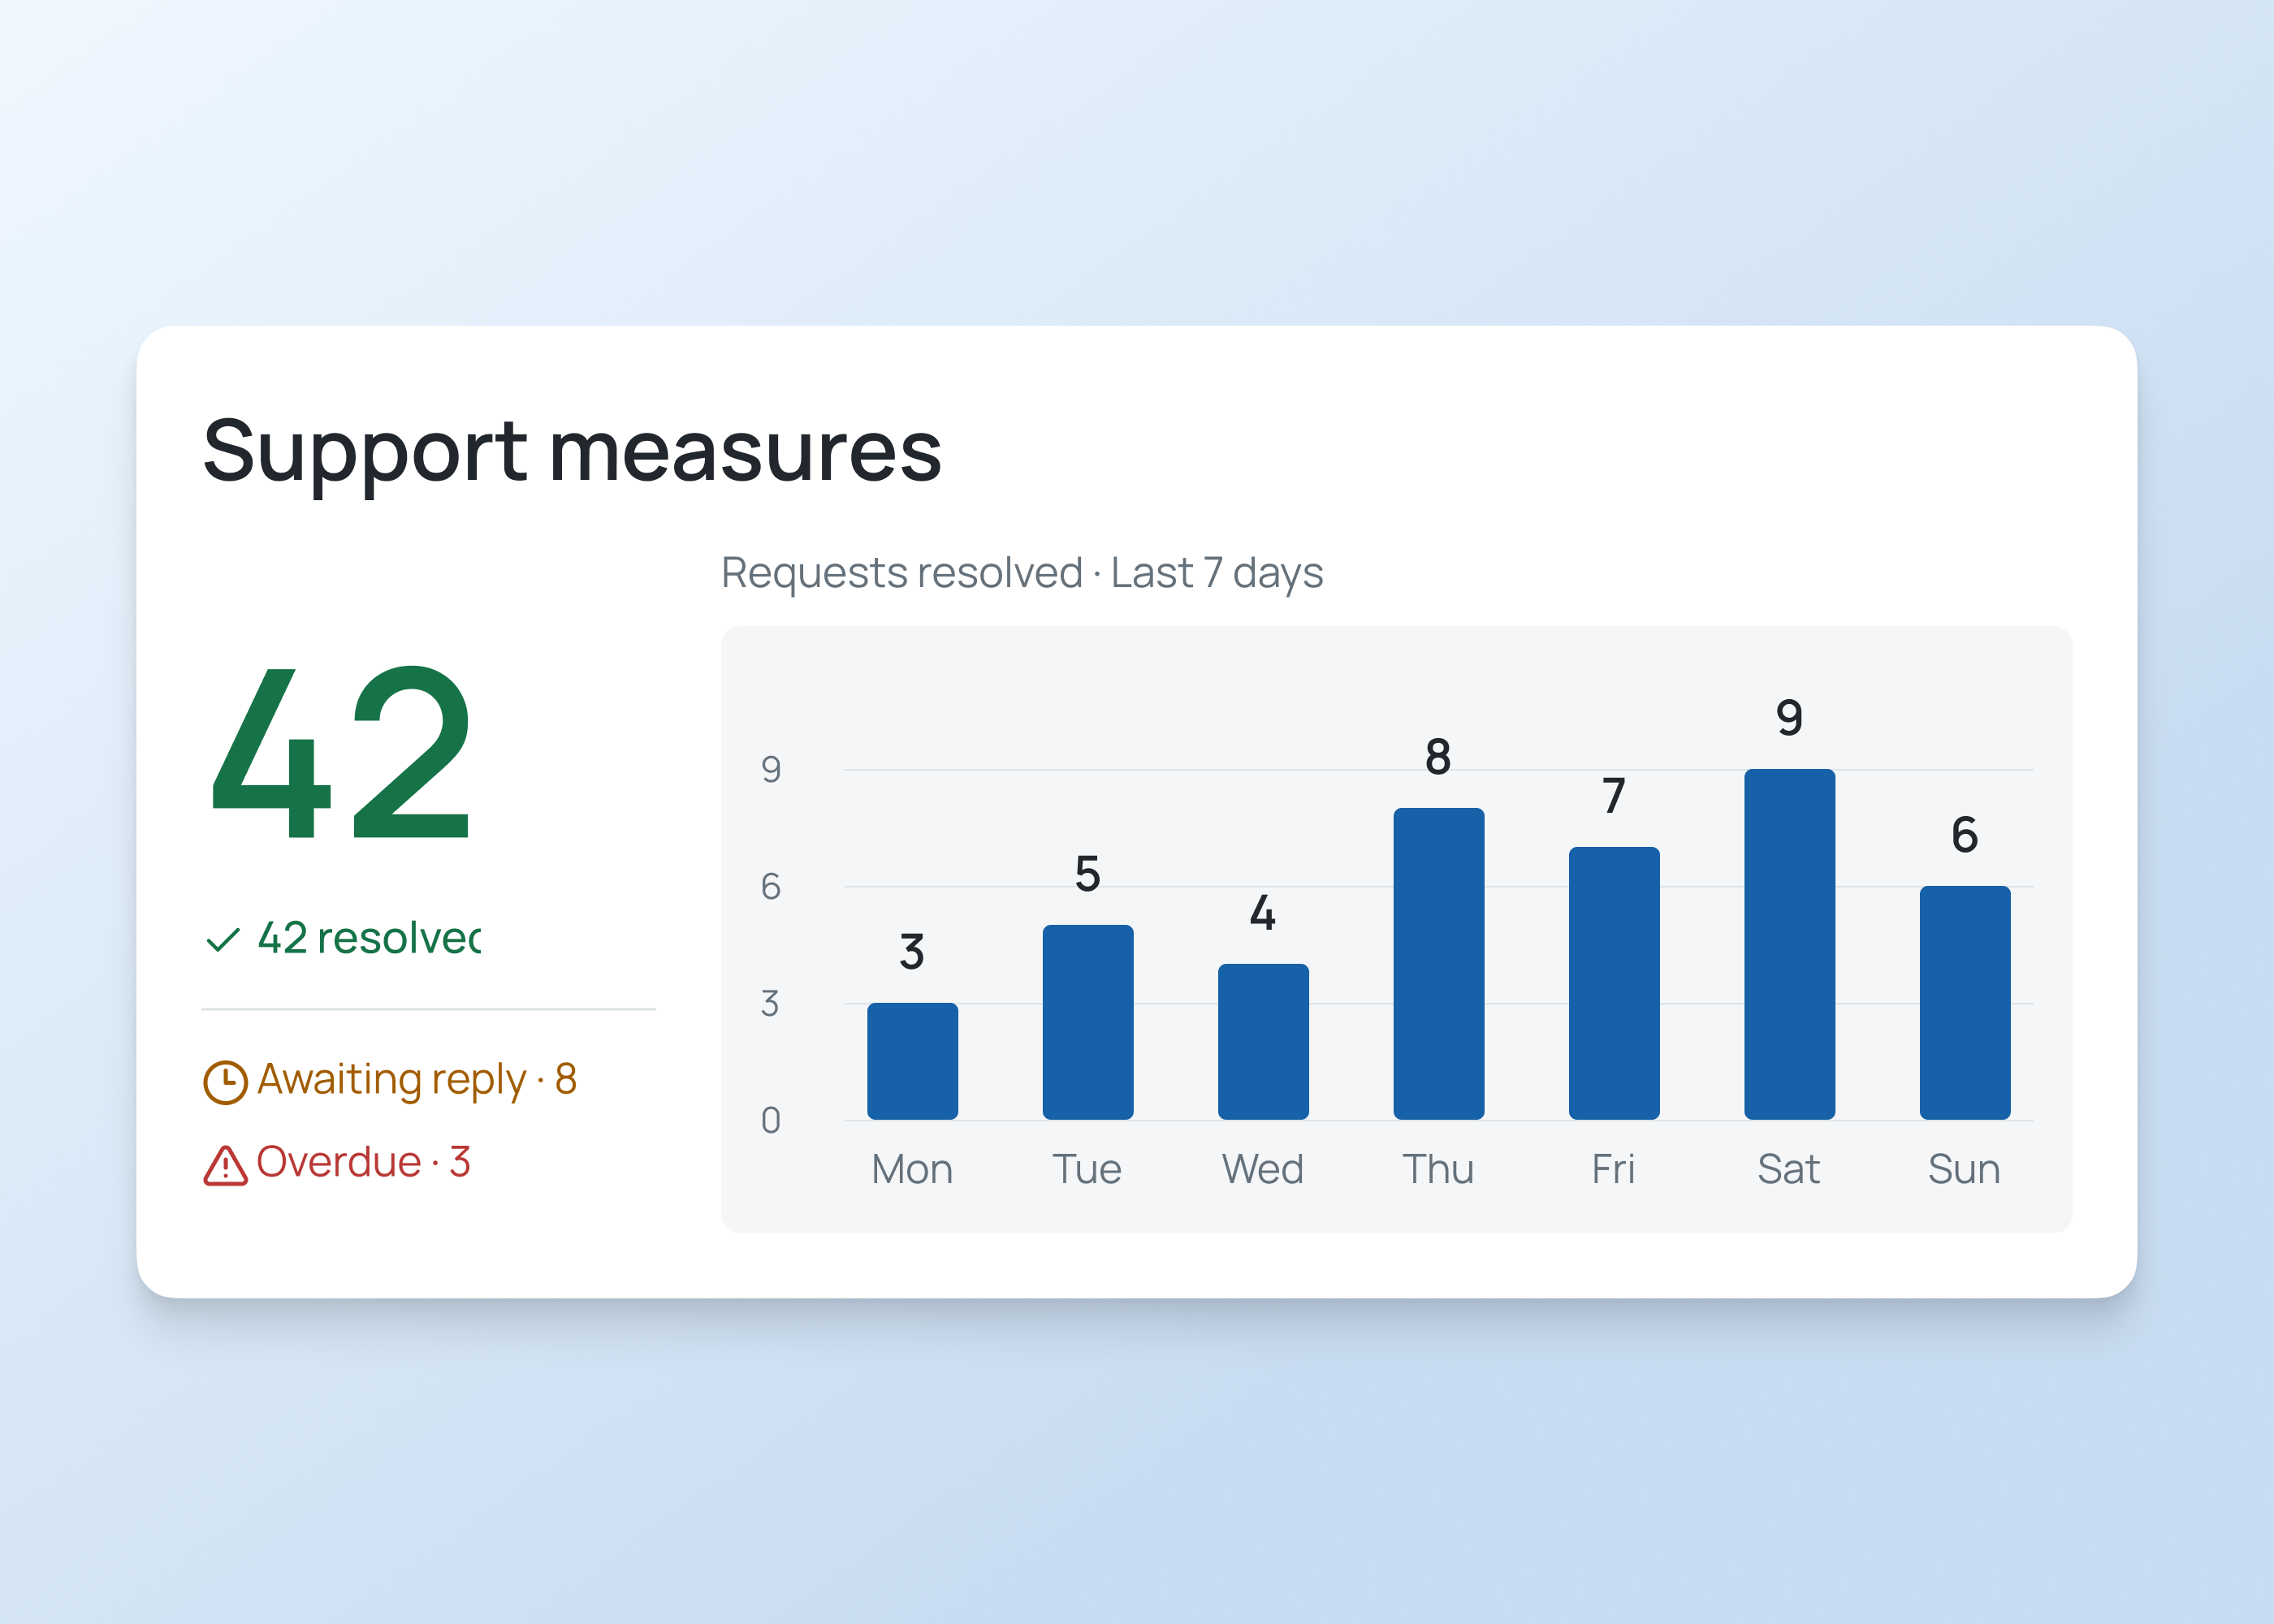
Compare completed requests by period and team, then show trends and related actions in an operations view.
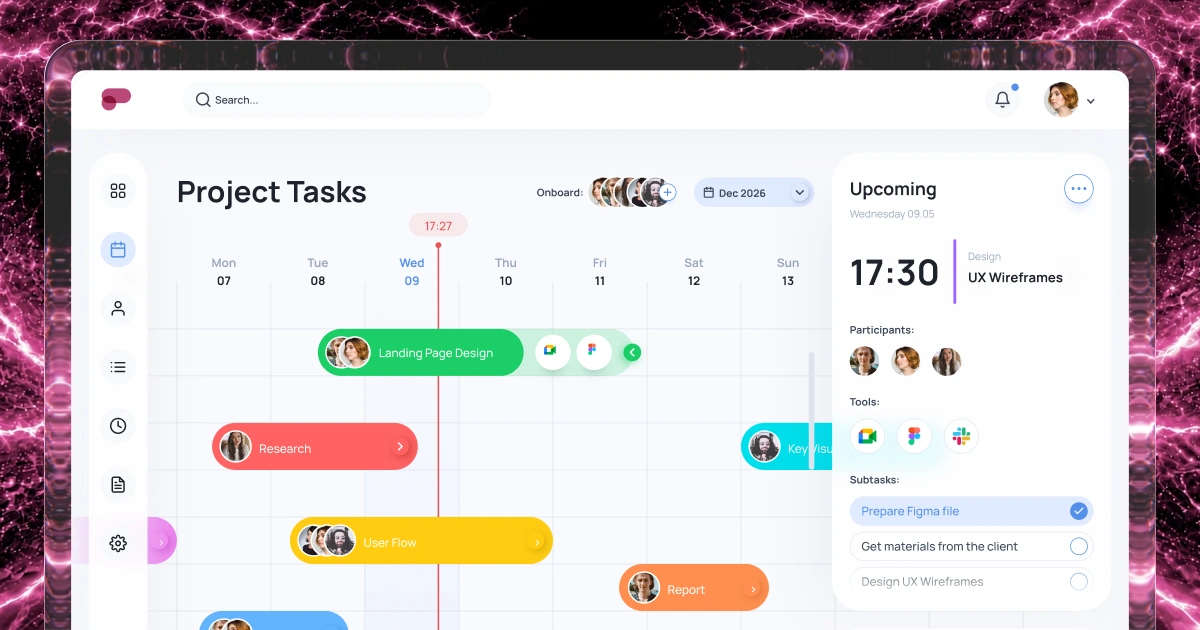
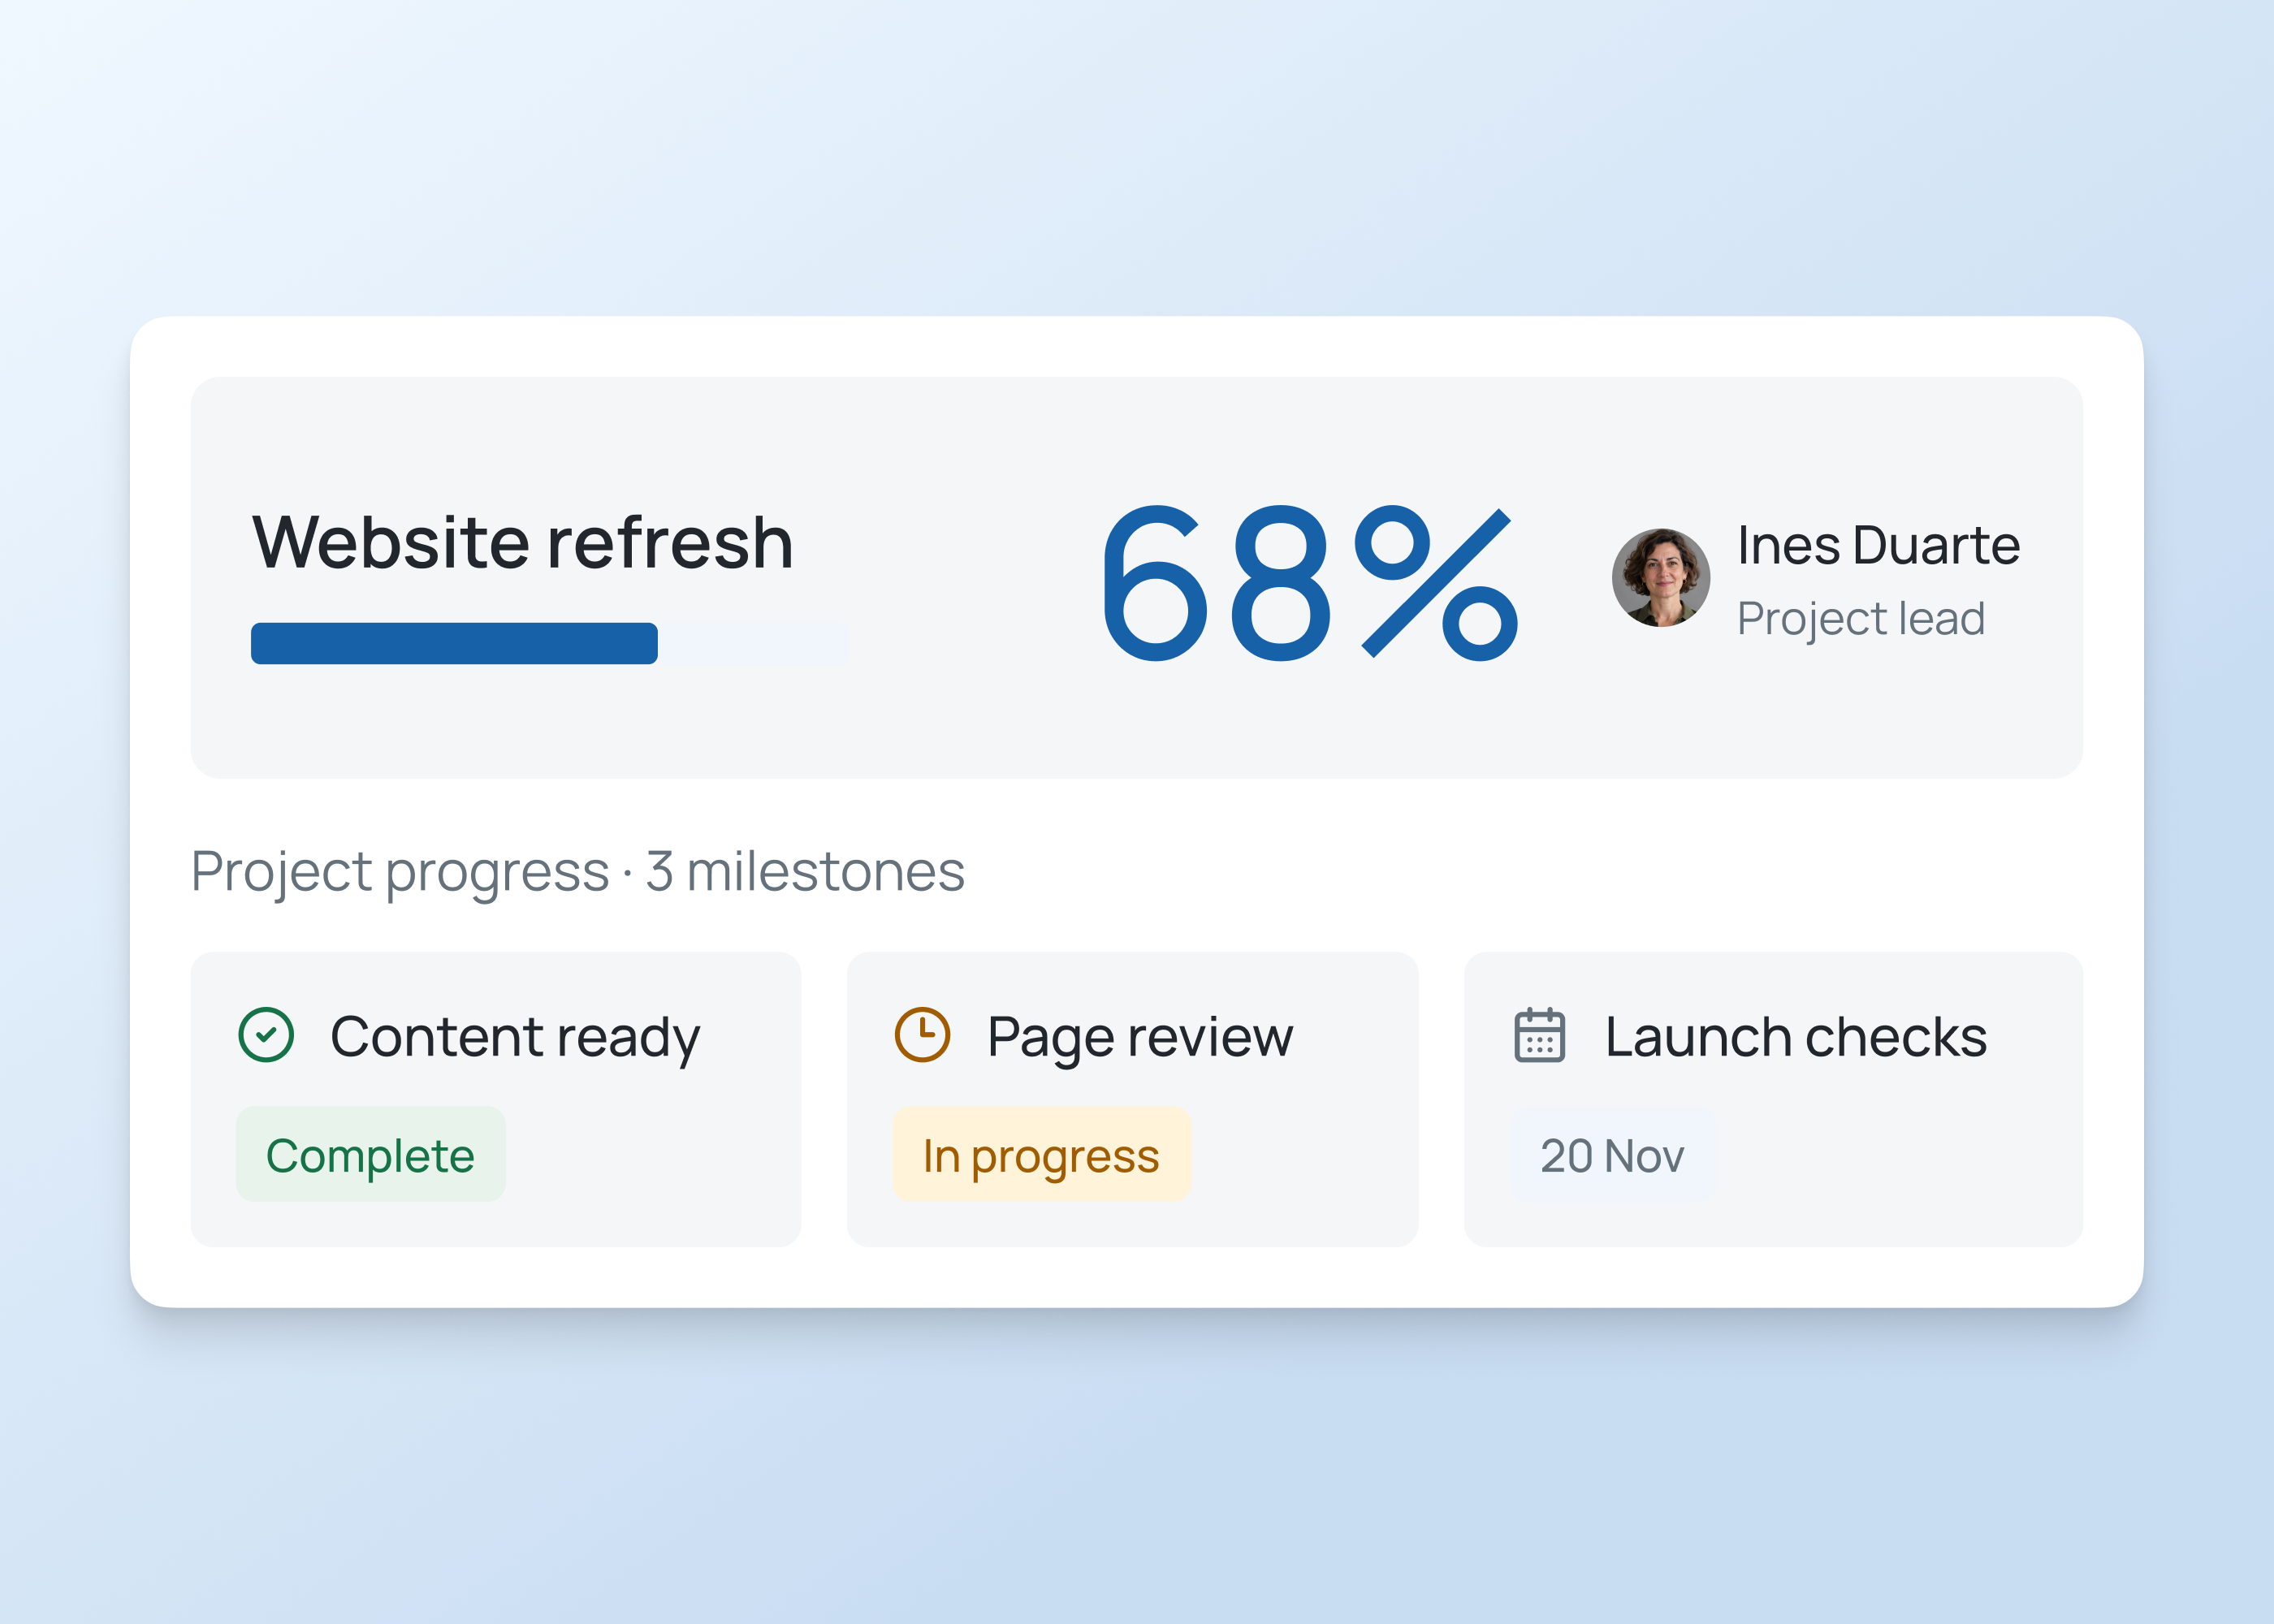
Analyze milestones, status changes and owners so teams can spot delays and follow up.
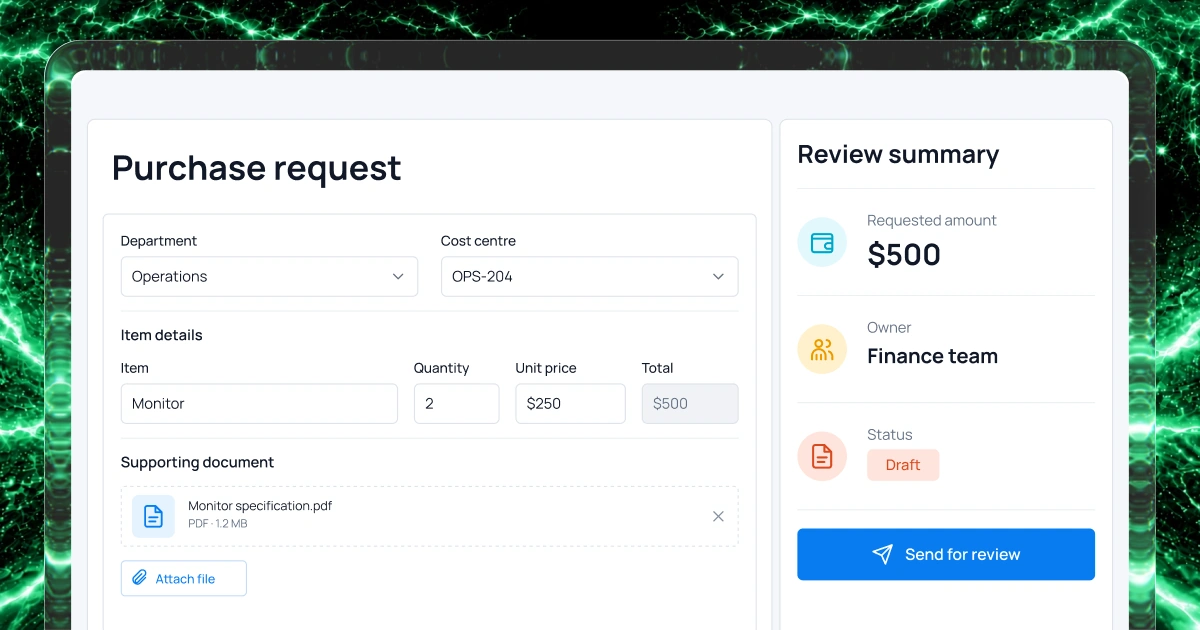
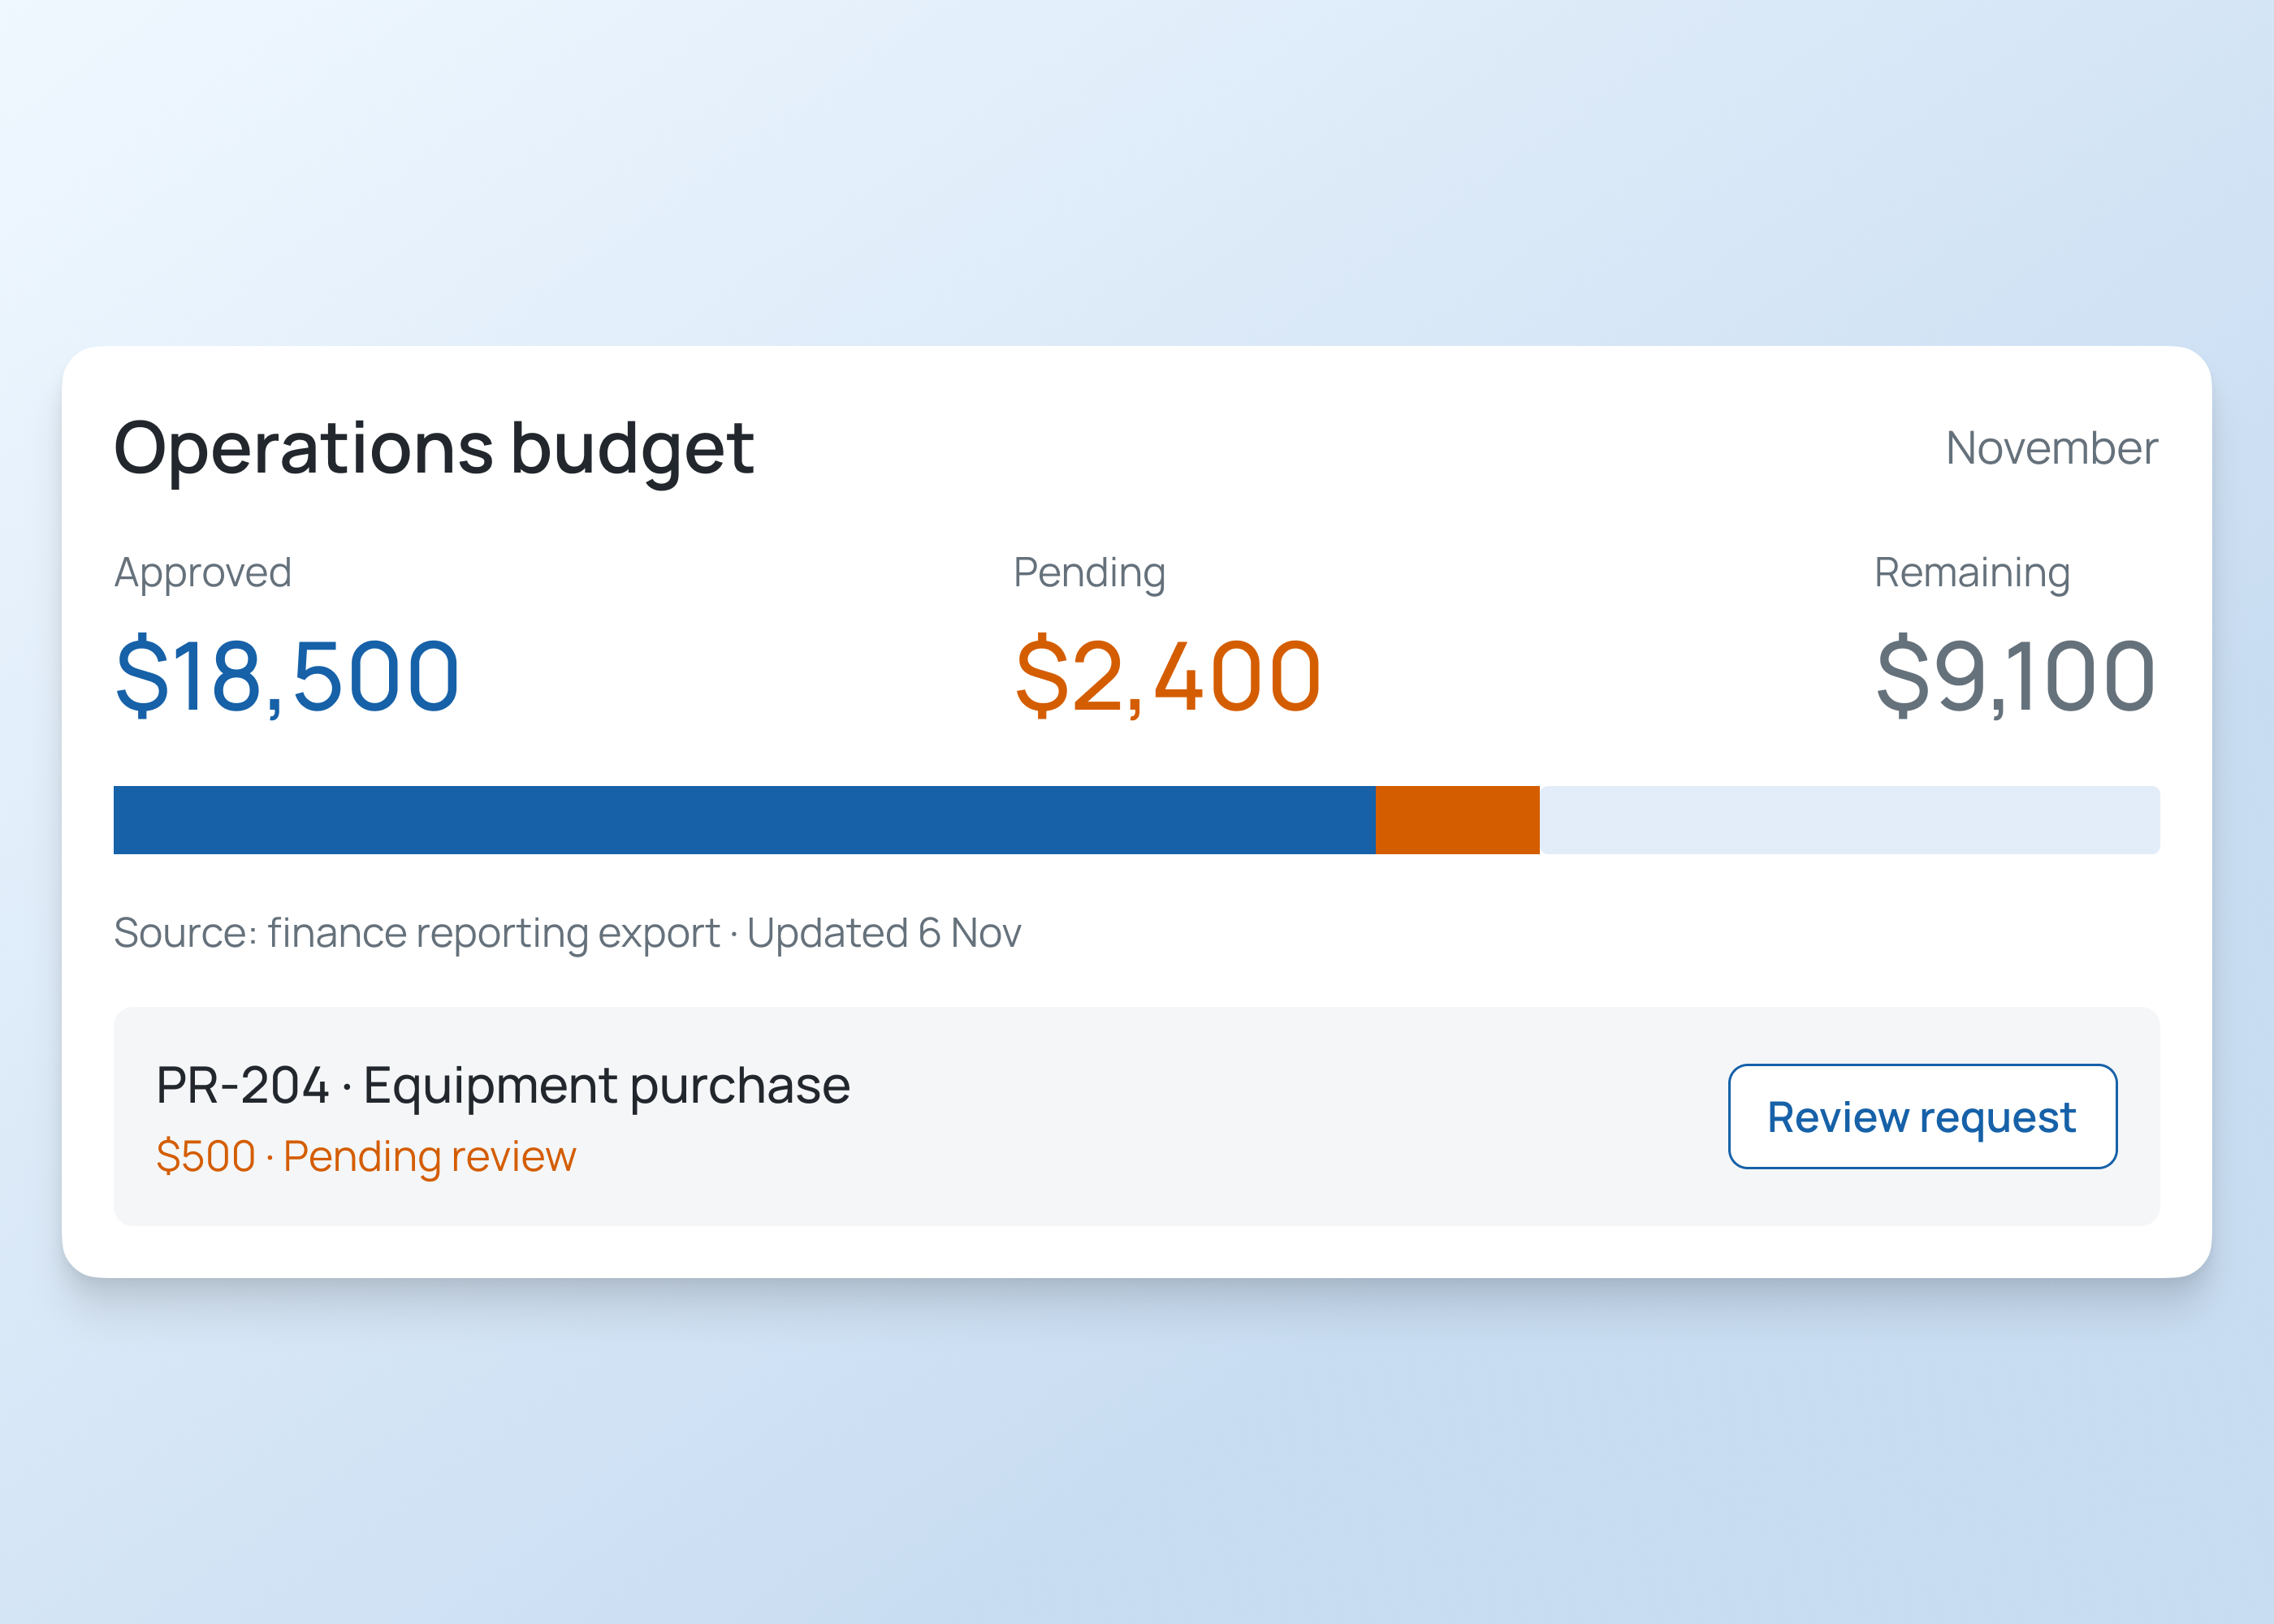
Compare agreed spend by period and cost centre, with clear source records for budget owners.
How it works
Describe the data and questions, compare sample results, then build and test dashboard views for each audience.
Build data analysis tools and dashboards with measures, filters and reporting views.
Tell Fliplet which questions, measures, comparisons and audiences matter to your team.
Review the generated screens and arrange measures, charts and filters around each audience.
Compare figures with source records. Test filters, access and data refresh before launch.
Who it's for
Give people ways to explore the data relevant to their work and dashboards that summarize the results they need.
Filter and compare information relevant to their work, then follow up on assigned actions.
Review dashboard trends across the team and identify areas needing attention.
Define measures, maintain sources and check that the figures are reliable.
Live training
Bring an idea, build with guidance and ask your questions.
Customer experience
Hear from teams using Fliplet to build software around the way they work.
“It was a really easy way to come up with specific-use solutions without a large infrastructure investment or a lot of IT time.”
“The big benefit is being able to have someone come to you with an idea or a problem, and being able to quickly spin up a prototype for them.”
Choose an example prompt or describe the measures, audiences and reporting process you need. Sign up or log in to continue in Fliplet, then review and refine the first version before publishing.
Fliplet is a software builder. Describe the questions, comparisons and dashboard views you need, then configure and test the measures, sources and access for your organization.
The Free plan includes 500 monthly credits plus 500 bonus credits in your first month to build and test a prototype. Publishing, end-user authentication and integrations require a paid plan. Compare current plans or book a demo to discuss your requirements.
Define the measures, calculations and context your team needs. Agree their source and ownership, then compare sample results with the source before relying on them.
Configure filters and comparisons to explore your data, then choose which results belong in each dashboard. Check calculations against source records before sharing.
The approach depends on the source system, its integration options, permissions and your Fliplet plan. Agree refresh timing and error handling, then configure and test the connection.
Configure views and access around the information each audience needs. Test permissions with representative users before introducing sensitive data.
The refresh schedule depends on the source and how the connection is configured. Agree the required timing and test it with the system owner.
Check calculations, filters, permissions, source data and refresh behavior with representative users. Agree who maintains each measure after launch.
Related solutions